Exit Strategy Toolkit for Optimization and Termination of Active Remediation Systems

Active remediation systems at petroleum underground storage tank (UST) sites often remain in operation even after they no longer effectively reduce risk or result in net environmental benefit. This happens for a variety of reasons, including the following:
- Lack of clear, established, and agreed-on remedial concerns, goals, and performance criteria
- Little use of published and readily available tools to inform remedial decision-making
- Uncertainty about the natural capacity of aquifer systems to attenuate key constituents of concern (COCs) below regulatory clean-up levels within reasonable time periods
The Exit Strategy Toolkit was developed for Shell by ARIS Environmental and Hers Environmental Consulting, Inc. to address these and other issues in UST remediation planning and implementation. The Toolkit offers a structured framework for selecting active remediation systems, optimizing their performance, and transitioning from active to passive remediation and ultimately to site closure (no further action) more confidently and sustainably in a manner protective of human and ecological receptors. This framework is intended to be integrated into an existing federal or state regulatory corrective action plan that ensures no adverse effects on human health and the environment. Certain elements of the Toolkit will require upfront stakeholder alignment on methods, tools, data needs, and criteria to support remedial decision-making.
The Motivation
It is a predicament practitioners find themselves in all too often at UST sites where there has been a release of light non-aqueous phase liquid (LNAPL) to the subsurface. Active remediation is initiated, and then continued, without sufficiently understanding three main questions:
- Will remedial goals and objectives ever be met?
- Is there more that can be done to optimize remedial performance to get to closure?
- Is it time to exit?
Practitioners are left in a state of uncertainty, lacking confidence in how or when to transition to a less energy-intensive form of remediation or terminate active remediation altogether. This often results in remediation systems that are no longer effective, sustainable, or providing net environmental benefits. Net environmental benefit can be evaluated in context of the ISO 18504:2017 definition for sustainable remediation: elimination and/or control of unacceptable risks in a safe and timely manner while optimizing the environmental, social, and economic value of the work. Moreover, their continued operation may delay brownfield redevelopment and squander clean-up (trust) funds and resources that could otherwise be put to better use. In such instances, the onus falls on the practitioner community to revisit cleanup objectives and determine whether the proper remedy was selected, appropriate data was collected to assess remedy performance and transitioning, and whether the remedy could be terminated confidently without a negative impact on human health and the environment. Written guidance is also needed to help avoid issues like this from arising in the future.
Over the years, numerous tools and guidance have been developed and published to help in remedial decision-making and navigating the remedial paradigm (API 2018; ITRC 2018).
The focus has largely been on improving the understanding of source-pathway-receptor linkages (site risk), honing conceptual site model (CSM) development, and selecting and implementing remediation measures that are fit for purpose. This guidance has been complemented by advancements in several areas. High-resolution site characterization tools have been instrumental in improving source identification, characterization, and remediation. Innovative approaches have been developed for measuring rates of physical migration (such as LNAPL transmissivity and mass flux/discharge) and natural attenuation of petroleum hydrocarbons in source areas (natural source zone depletion, or NSZD) and along groundwater and vapor migration pathways. Despite these advanced methods, there is still uncertainty about whether and when to terminate active remediation. The reasons for this can include:
- An absence of key data and/or a focus on data that have little to do with actual risk (such as hydrocarbon mass removal rates).
- An “old-school” mentality reluctant to try or embrace new tools and guidance.
- Inexperience in integrating the latest science, such as NSZD, into remedial frameworks.
- Absence of a practical framework that collectively addresses relevant issues and helps stakeholders make more informed, confident remedial decisions.
Because a practical framework is something tangible that can be addressed, we developed and published this Exit Strategy Toolkit incorporating recent science and tools on remediation performance. The Toolkit is intended for application at sites with on-going as well as proposed remediation.
What Exactly is the Exit Strategy Toolkit?
The Exit Strategy Toolkit is a series of factsheets that provide a systematic framework to initiating, evaluating, implementing, and terminating active remediation systems. The Toolkit is a web-based tool available at https://naplansr.com/tools/exit-strategy-toolkit/. Use of the Toolkit is expected to increase stakeholder confidence in remedial decision-making, minimize unnecessary active remediation, and ultimately achieve more successful, sustainable remedial outcomes. The Toolkit reinforces good practice by emphasizing the importance of establishing and agreeing on critical elements of the remedial approach.
The Toolkit consists of a Compendium that serves as an overarching framework and roadmap for a series of technology-specific factsheets on hydraulic recovery, soil-vapor extraction (SVE), air (and bio) sparging, bioventing, and natural attenuation. The Toolkit is user-friendly and easy to follow, yet sufficiently detailed, with best practices, tools, and methods in appendices or referenced through online links. The Toolkit can be applied at sites where remediation is being planned or is ongoing. It is designed for use by key stakeholders involved in remedial decision-making, including consultants, industry representatives, and environmental regulators who oversee the management of individual sites or portfolios of sites impacted by LNAPL.
The Toolkit focuses on active remediation, not CSM development, although the CSM is inherently fundamental to optimizing remediation and efficiently meeting remedial goals. References to guidance on developing petroleum-related CSMs are provided in the Toolkit. The CSM is thus assumed to be firmly established and updated or refined, as necessary, throughout the site investigation and remedial process. The CSM should be reviewed to identify potential deficiencies or gaps, especially at sites where remediation is ongoing and remedial goals are not being met.
The Four-Stage Remedial Paradigm
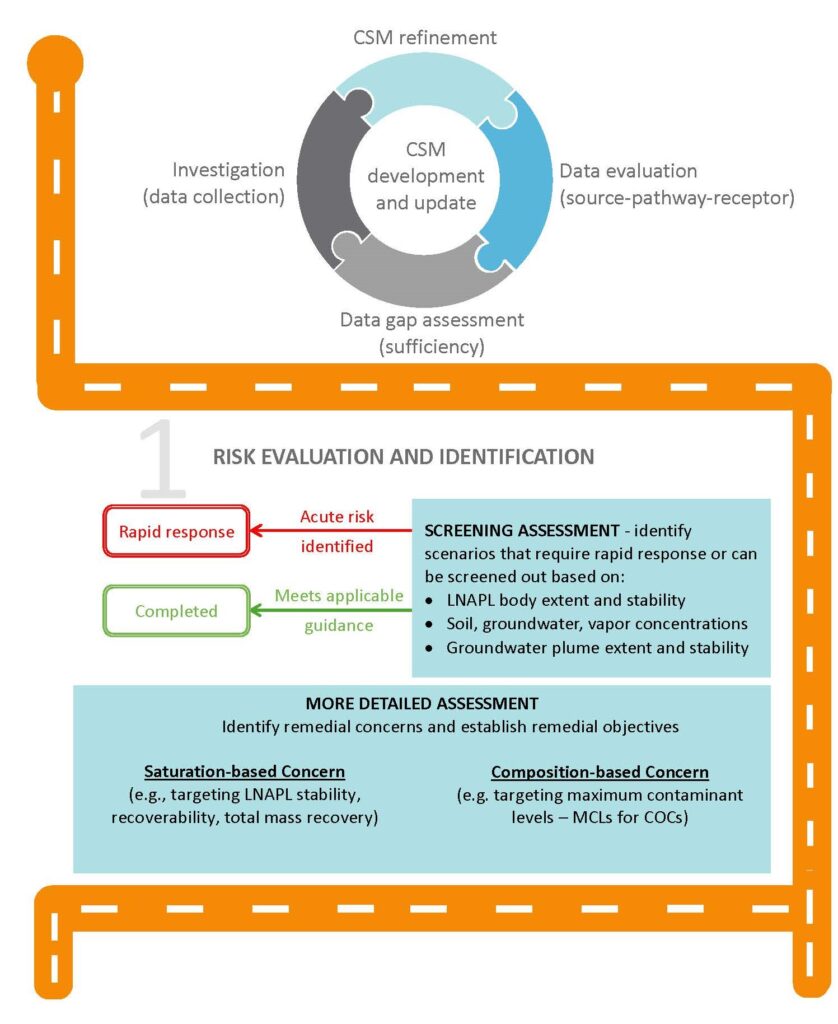
The remedial framework presented in the Compendium is based on a four-stage process (Figure 1a and 1b), listed below. These stages are often missing from guidance or are not meaningfully incorporated into remedial frameworks at the outset or considered when re-evaluating or re-defining objectives during the remedial process.
Stage 1: Risk Evaluation and Identification: identify remedial concerns and goals.
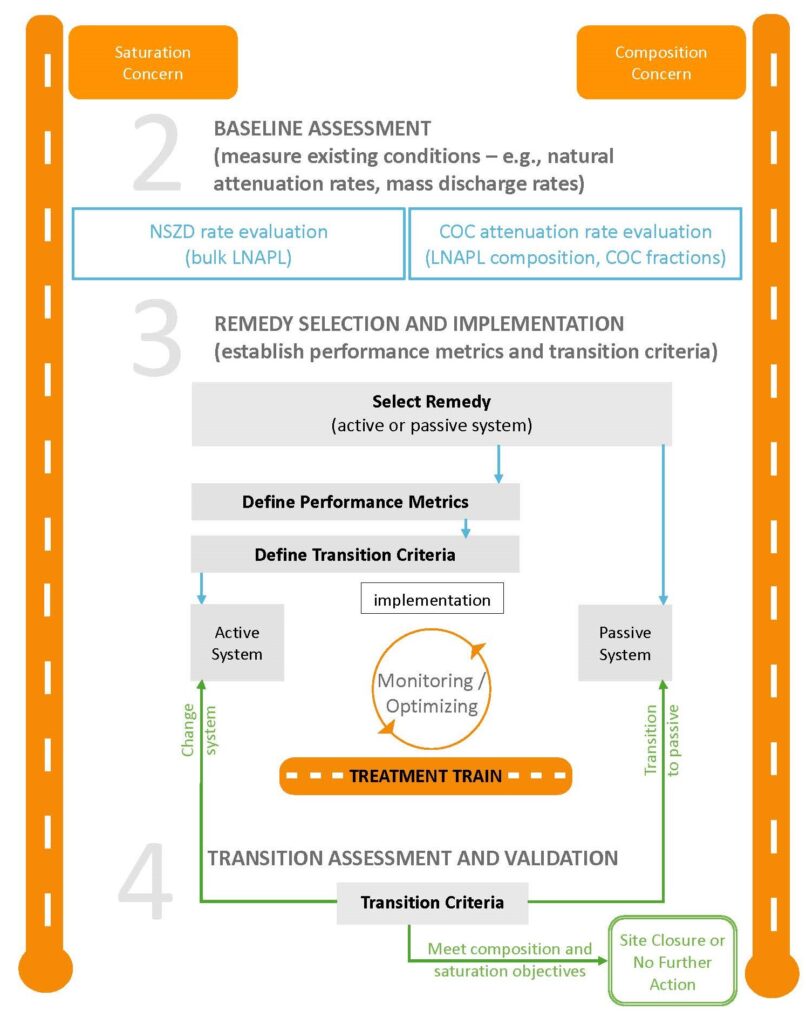
Stage 2: Baseline Assessment: conduct natural attenuation rate assessment.
Stage 3: Remedy Selection and Implementation: establish performance metrics for system monitoring and optimization.
Stage 4: Transition Assessment and Validation: apply pre-defined thresholds for transitioning and terminating active remediation.
Stage 1 – Risk Evaluation and Identification
The Toolkit in Stage 1emphasizes the importance of upfront concurrence on remedial concerns and goals (or objectives) among all stakeholders (Table 1). It is also critical in Stage 1 to identify acute safety or other risks that warrant rapid response. The CSM must be sufficiently developed to assess whether the LNAPL concern (and associated remedial goal) is saturation (mass)- or composition-based. A saturation-based concern commonly involves LNAPL recovery to remove and control LNAPL that is migrating or spreading (migrating LNAPL), or to reduce LNAPL that is present in monitoring wells (mobile LNAPL, but not migrating). A composition-based concern targets LNAPL that acts as a source for key COCs that exceed regulatory cleanup values or risk-based guidelines for various media-specific exposure pathways. Risk-based guidelines may be derived following an exposure evaluation (source-receptor-pathway) or quantitative risk assessment approach in accordance with applicable regulatory requirements.
| Identified Risk or Concern | Primary Remedy | Remedial Goal |
|---|---|---|
| Saturation: Presence of migrating or mobile LNAPL. | Mass removal or recovery. | Abate LNAPL migration or reduce mobile LNAPL. |
| Composition: Concentrations or mass discharge/loading exceeding health-based criteria (human or ecological). | Phase change and mass reduction. | Reduce concentrations or mass discharge/loading. |
The remedial goal ties directly to the identified remedial risk or concern: whether to abate LNAPL migration or decrease LNAPL mass (saturation) or reduce COC concentrations below a regulatory level (composition). The remedial goal drives the choice of remedial technology (e.g., hydraulic recovery, SVE, bioventing), the type of baseline assessment (Stage 2), the metrics and thresholds used to gauge remediation performance and transition criteria (Stages 3 and 4), and associated data needs. The remedial goal should also factor in a reasonable timeframe and the ultimate transition to a passive system (monitored natural attenuation, or MNA) and/or site closure.
Stage 2 – Baseline Assessment
Stage 2 encompasses the measurement and analysis of natural attenuation rates prior to the initiation of remediation (ideally) or potentially during remediation while the system is turned off (planned as part of the transition process). This information is used as a baseline in remedial decision-making. The natural attenuation rate can be estimated using existing data, for example, by applying simple screening models such as U.S. EPA BioScreen model (U.S. EPA 1996) or applying tools described in Strasert et al. (2022) or from new data (ASTM 2022) that are not routinely collected during site investigation, such as NSZD rate measurements. For a saturation-based concern, natural attenuation rates are typically estimated from bulk LNAPL attenuation. For a composition-based concern, natural attenuation rates are typically estimated for key COCs in relation to concentration or mass discharge.
The baseline attenuation rates can be used for the following purposes:
- As a baseline for monitoring hydrocarbon mass loss rates (bulk LNAPL depletion or COC attenuation) and plume migration and attenuation.
- Inform remedy selection in Stage 3, including evaluation of whether an active or passive remediation system is warranted.
- Support termination of active remediation in Stage 4.
The Exit Strategy Toolkit Natural Attenuation Factsheet details guidance, methodologies, tools, analyses, and data needs to support MNA, groundwater plume attenuation rate estimates, and NSZD, and directs the user to associated references (several key references are ITRC 2009; ITRC 2018; CRC Care 2018; CL:AIRE 2019; ASTM 2022).
Stage 3 – Remedy Selection and Implementation
Stage 3 focuses on selection and implementation of the remedy, which should be consistent with the remedial concerns and goals identified in Stage 1 and the baseline attenuation rates estimated in Stage 2. The Toolkit provides key guidance and resources to aid in remedy selection and monitoring performance. Remedies that target bulk hydrocarbon removal, such as excavation and hydraulic recovery, should be selected if the concern is LNAPL saturation. Remedies that target physical phase changes and enhance biodegradation and abiotic reactions should be applied at sites with composition-based concerns. These include multi-phase extraction (MPE), SVE, air sparging, bioventing, biosparging, and in-situ chemical oxidation. Many sites require a treatment train approach, with sequential implementation of various active remedies to address both saturation- and composition-based concerns; or use of technologies, such as MPE, that may simultaneously address both concerns.
The first step is identifying and agreeing on the appropriate remediation technology. Performance metrics and transition thresholds are established with stakeholders prior to the onset of remediation.
Once the system is implemented, it is critical to monitor and confirm that the remedy performance is acceptable, optimized, and sustainable. Performance assessment is conducted during the lifecycle of remediation to determine if progress aligns with the remedial concern. The performance assessment typically involves a review of the CSM to identify deficiencies and gaps, application of performance metrics and transition thresholds, and benchmarking hydrocarbon plume migration or mass loss rates against baseline rates of natural attenuation assessed in Stage 2.
The performance metrics and transition thresholds presented in Table 2 provide the basis for optimization and transition. Performance metrics for a given remediation technology are both subsurface- and system-related. Those related to the subsurface are applied and evaluated before, during, and after remediation system operation, and can include monitoring of potential rebound in COC concentrations when, for example, a pumping or SVE system is provisionally turned off.
Each Toolkit technology factsheet addresses potential system optimization measures, such as changes in well location and design, pulsed versus continuous operation, and use of amendments. The technology factsheets also include system monitoring and performance assessment tools. For examples, new tools such as remote sensing and telemetry are designed to enhance system performance and sustainability through improved data collection (e.g., data on greenhouse gas, or GHG emissions and energy use), reduced exposure hours, and lowered costs of operation. Collection of targeted and timely data can lead to more optimal remediation performance.
Key guidance and resources to support remedy selection include the ITRC LNAPL Guidance (ITRC 2018) and the Remediation Technologies Screening Matrix (Federal Remediation Technologies Roundtable, FRTR). Guidance on the greening of remediation and environmental footprint analysis includes U.S. EPA (2012) and U.S. EPA (2019). The Golder (2016 and 2021) Remediation Toolkits address sustainability principles and indicators, remedy transition, and footprint analysis. The Concawe LNAPL Toolbox makes available multiple tools and models to characterize LNAPL fate and transport (Strasert et al. 2022). Several other tools and aids are referenced in the Exit Strategy Toolkit.
Example Performance Metrics
S = Saturation C = Composition
| Subsurface related | System related (Measurements at header or individual extraction wells) |
| LNAPL stable footprint based on absence in sentinel wells (S). | LNAPL recovery vs. time, cost, or GHG emissions (S). |
| LNAPL transmissivity (S). | LNAPL decline curve analysis (S). |
| LNAPL velocity (S). | LNAPL/vapor or LNAPL/water ratio (S). |
| LNAPL fraction remaining is below threshold of concern, i.e., primarily residual LNAPL (S). | TPH/COC mass recovery vs. time, cost, or GHG emissions (C). |
| NSZD rate (bulk TPH or COC) (S and C). | TPH/COC concentration attenuation (C). |
| Concentration or mass flux/discharge of COC in soil gas or groundwater (C). | COC ratios in water or vapor (C). |
| Distribution of geochemical parameters or electron acceptors (S and C). | Pressures, flow rates (S and C). |
| N/A | Soil-gas temperatures (C). |
| Example Transition Thresholds |
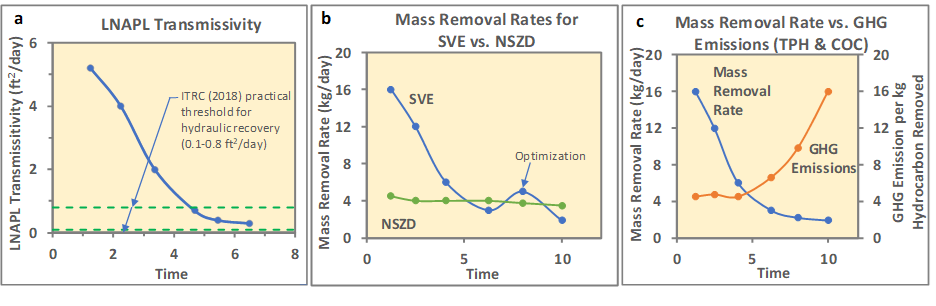
| Recovery of sufficiently high fraction of LNAPL (90-95%) quantified through decline curve analysis (S). |
| LNAPL transmissivity below ITRC (2018) threshold of 0.1-0.8 ft2/day (S). |
| Concentrations or mass discharge at or approaching criteria within accepted statistical certainty (C). |
| Active remediation mass recovery rates similar to or less than NSZD (bulk) rates (S). |
| Active remediation concentration attenuation rates similar to or less than natural attenuation rates (C). |
| Cumulative mass removal or concentration attenuation by active recovery approaching asymptotic levels while ratio of GHG emissions or cost per unit reduction or concentration is rapidly increasing (S and C). |
Example Performance Metrics
| System Related | Subsurface Related |
| – LNAPL recovery vs. time, cost or greenhouse gas (GHG) emissions (S). | – LNAPL stable footprint based on absence in sentinel wells (S). |
| – LNAPL/vapor ratio or LNAPL/water ratio (S). | – LNAPL transmissivity (S). |
| – TPH/COC mass recovery vs. time, cost or GHG emissions (C). | – LNAPL fraction remaining is below threshold of concern, for example, primarily residual LNAPL (S). |
| – TPH/COC concentration attenuation (C). | – LNAPL velocity (S). |
| – COC rations in water or vapor (C). | – NSZD (bulk TPH or COC) rate (S and C). |
| – Pressures, flow rates (S and C). | – Concentration of mass flux/discharge of COCs in soil, gas, or groundwater (C). |
| – Soil-gas temperatures (C). | – Distribution of geochemical parameters or electron acceptors (S and C). |
Notes: TPH = total petroleum hydrocarbon; COC = constituent of concern ; GHG = greenhouse gas; NSZD = natural source zone depletion; ITRC = Interstate Technology and Regulatory Council.
Stage 4 – Transition Assessment (Active Systems) and Validation
The final step in the process is to compare remedy performance to the transition thresholds, and validate transitions from active to passive remediation or ultimately site closure. Effective and confident transitions should invoke multiple lines of evidence based on key metrics (such as hydrocarbon mass reduction or COC concentrations) to conclude that the system no longer produces a benefit (see Table 2). The Toolkit graphically illustrates and describes various transition thresholds that can be used as lines of evidence, such as assessment of LNAPL transmissivity change over time, comparison of remediation mass removal rates to baseline assessment natural attenuation rates, and evaluation of metrics such as GHG emissions, with examples provided in Figure 2. Detailed information on metrics, thresholds, and optimization for the transition thresholds are provided in the Toolkit’s technology-specific factsheets.
Transition thresholds, like performance metrics, should be agreed on with stakeholders prior to the onset of active remediation, since the thresholds will dictate the type and timing of data collection before and during active remediation. The transition threshold may also shift over time at sites where remediation treatment trains are implemented. For example, early in remediation a transition threshold may be LNAPL transmissivity declining below a practical limit of hydraulic recovery. Later in remediation, the transition metric may shift to threshold COC concentrations (maximum contaminant levels, or MCLs) and/or threshold mass discharge or mass loading limits.
Conclusions
The Exit Strategy Toolkit has been created to help improve remedial decision making and remediation operation while ensuring that there is no risk to human health and the environment. The primary motivation of the Toolkit is to address active UST LNAPL remediation systems that remain in operation even though they no longer effectively reduce the threat of an exposure or provide a net environmental benefit. The Toolkit serves as a framework for systematically optimizing the performance of active remediation systems and transitioning to site closure more confidently and sustainably. The four-stage strategy involves risk evaluation and identification; baseline assessment; remedy selection and implementation; and transition assessment and validation. The Toolkit contains a Compendium and a series of factsheets on natural attenuation and active remediation technologies. The approach in the Toolkit can be adapted for use in other guidance with similar objectives. For example, much of the information contained in the Toolkit is being incorporated into draft ASTM Standard Guidance designed to support petroleum UST site closures. We encourage those interested in the Toolkit to view or download it at https://naplansr.com/.
Acknowledgements
The review and comments provided by Dr. Parisa Jourabchi of ARIS Environmental Ltd. are gratefully acknowledged.
References
American Petroleum Institute (API). 2018. Managing Risk at LNAPL Sites. Frequently Asked Questions, Second Edition, Soil and Groundwater Research Bulletin No. 18, May 2018, updated May 8, 2019. https://www.api.org/-/media/files/ehs/clean_water/bulletins/18_bull_hires.pdf.
American Society for Testing and Materials (ASTM). 2022. ASTM E3361-22. Standard Guide for Estimating Natural Attenuation Rates for Non-Aqueous Phase Liquids in the Subsurface. https://www.astm.org/e3361-22.html.
Contaminated Land: Applications in Real Environments (CL:AIRE) 2019. Technical Bulletin 20: an introduction to natural source zone depletion at LNAPL sites, CL:AIRE, London, UK. https://www.claire.co.uk/component/phocadownload/category/17-technical-bulletins?download=681:tb-20-an-introduction-to-natural-source-zone-depletion-at-lnapl-sites.
Cooperative Research Centre for Contamination Assessment and Remediation of the Environment (CRC CARE). 2018. Technical measurement guidance for LNAPL natural source zone depletion. Technical Report #44, CRC for Contamination Assessment and Remediation of the Environment, Newcastle, Australia. https://crccare.com/technical-reports/.
Federal Remediation Technologies Roundtable (FRTR) Assessment Reports https://frtr.gov/costperformance/remediation/.
Golder Associates Ltd. 2016. Remediation Toolkits. Toolkit 1: Summary of Toolkits and Conceptual Site Model and Case Studies (July 8, 2016); Toolkit 2: Monitoring and Prediction (July 8, 2016); Principal authors: Parisa Jourabchi (Toolkits 1 and 2) and Ian Hers7 (Toolkits 1 and 2) https://csapsociety.bc.ca/csap-toolkits/.
Golder Associates Ltd. 2021. Remediation Toolkits. Toolkit 3: Evaluation of Remediation Technologies for Petroleum Hydrocarbon Sites (April 5, 2021); Toolkit 4: Methods for Sustainable Remediation (April 6, 2021); Principal authors: Ian Hers7 (Toolkits 3 and 4), Parisa Jourabchi (Toolkits 3 and 4), Francois Beaudoin (Toolkit 4) https://csapsociety.bc.ca/csap-toolkits/.
ITRC. 2009. Evaluating Natural Source Zone Depletion at Sites with LNAPL, Technology Overview, Prepared by The Interstate Technology & Regulatory Council LNAPLs Team, April 2009. https://itrcweb.org/viewdocument/evaluating-natural-source-zone-depl?CommunityKey=0c358b0a-a5b9-4fd7-a832-11888551a153&tab=librarydocuments.
Interstate Technology and Regulatory Council (ITRC). 2018. LNAPL site management: LCSM (LNAPL CSM) evolution, decision process, and remedial technologies. LNAPL-3. Washington, DC. Interstate Technology & Regulatory Council. LNAPL Update Team. https://lnapl-3.itrcweb.org.
Strasert, B., Newell, C.J., de Blanc, P., Kulkarni, P., Whitehead, K., Sackmann, B., and H. Podzorski. 2022. Concawe LNAPL Toolbox, Concawe, Brussels, Belgium. https://lnapltoolbox.concawe.eu/lnapl_toolbox/.
U.S. Environmental Protection Agency (EPA). 1996. BIOSCREEN, Natural Attenuation Decision Support System – User’s Manual, Version 1.3 (PDF). Publication No. EPA/600/R-96/087. August 1996.
U.S. EPA. 2012. Methodology for Understanding and Reducing a Project’s Environmental Footprint EPA 542-R-12-002. February. https://www.epa.gov/sites/production/files/2015-04/documents/methodology_enivro_footprint.pdf.
U.S. EPA. 2019. Spreadsheets for Environmental Footprint Analysis (SEFA) Version 3.0. https://clu-in.org/greenremediation/SEFA.
Authors
Issue: #94 | View Archives
Connect With Us
Sign up for our monthly
e-newsletter