Implementing High-Resolution Site Characterization in South Carolina’s UST Management Program
The Foundation
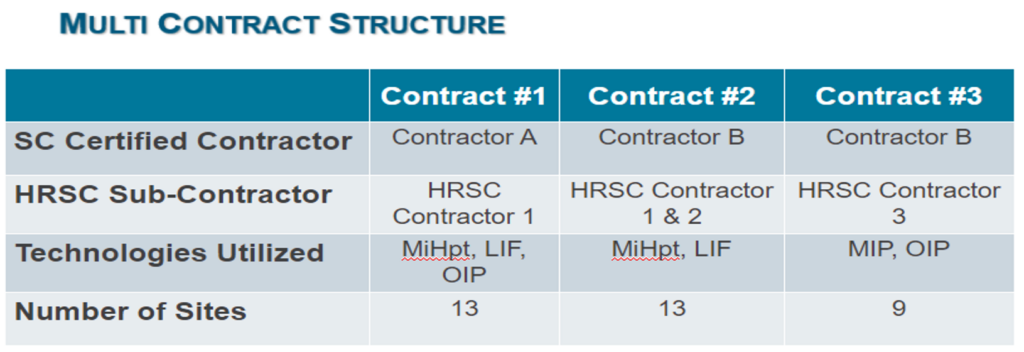
The UST Division of the South Carolina Department of Health and Environmental Control (SCDHEC) was first introduced to high-resolution site characterization (HRSC) through suggestions made by South Carolina certified UST contractors. This technology was seen as a potential tool to aid in the delineation of UST releases. Additionally, HRSC reports were reviewed by SCDHEC’s non-permitted petroleum section, highlighting the benefits of HRSC in accurately identifying and delineating petroleum contamination in the subsurface. Recognizing the potential value of HRSC in improving site assessments, the UST Division embarked on pilot studies for HRSC in 2018. These studies aimed to explore the technology and compare it to traditional assessment methods, test the limitations of HRSC, and ultimately develop reimbursable rates for HRSC work within the UST program. Throughout the three case studies, the UST Division collaborated with two state certified contractors and three HRSC firms, providing an opportunity to observe the variations in HRSC capabilities at petroleum releases across the state. Figure 1 outlines the structure of the three case studies:
Pilot Study 1 – A Brief Case Study
The primary objective of the first pilot study was to compare HRSC to traditional investigative methods. One notable facility from this study is UST Permit #19190, situated in the piedmont region of South Carolina. In 2012, a single release was reported at this facility, however information regarding the status and total number of USTs remained unknown. A Sanborn map revealed the presence of a dry-cleaning facility adjacent to permit #19190. Laser induced fluorescence (LIF) and a membrane interface probe (MIP) were the primary HRSC tools used at this site. The LIF and MIP points were compared to diesel range organics (DRO) and gasoline range organics (GRO) soil borings. Figure 2 shows one of the potential benefits of using HRSC.
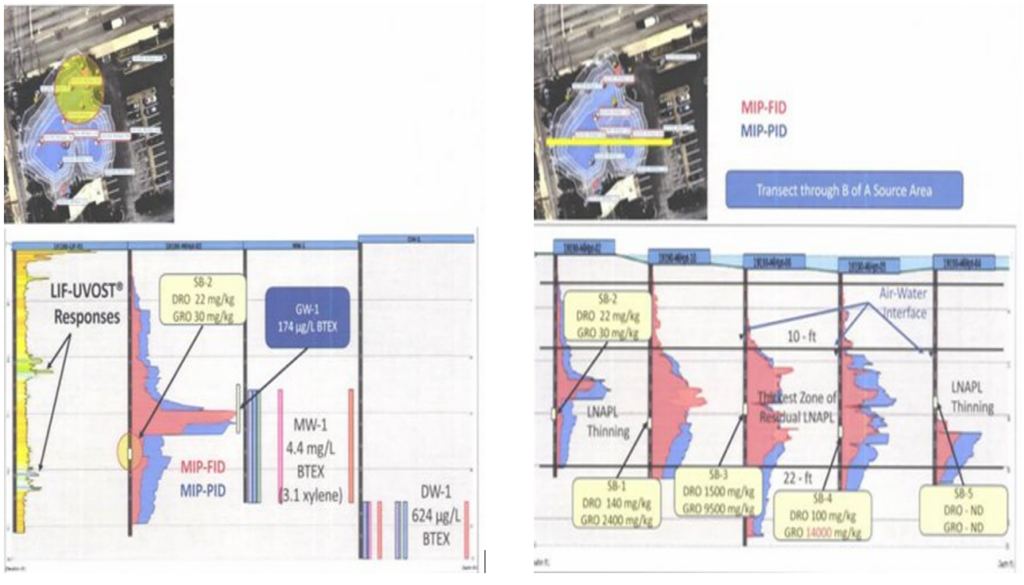
Figure 2 represents LIF, MIP, DRO and GRO, and groundwater samples overlayed together. The DRO and GRO soil samples were often collected near, but not right at the highest concentration interval of the borings. MIP and LIF can be used to determine the exact depths and locations of the highest concentration areas more accurately.
Before HRSC was employed at the facility, assessment reports indicated that LNAPL extended north of the site and across the street on an adjacent property. LIF was implemented to assess the LNAPL plume and find the migration pathways that the product could be traveling through. Figure 2 shows the three-dimensional LIF model developed by the HRSC firm. The resulting data shows that the product observed to the north and across the street from the facility could potentially be attributed to a nearby historical dry-cleaning release. This was determined because LIF has the capability to distinguish between different types of products based off the wavelength the product fluoresces. The wavelengths on the offsite property were comparable to Stoddard solvent constituents while the onsite wavelengths were comparable to gasoline and motor oil range constituents.
The limitations of HRSC on this facility were access issues, utilities, shallow boring refusal, and downtime the contractors had due to equipment troubleshooting. The lessons learned include that LIF is able to distinguish between solvent and gasoline products, and that HRSC could fill in data gaps that traditional soil borings might miss. In identifying the solvent product, the UST Division was able to eliminate the use of state funds in cleaning up that specific release and apply focus to the gasoline release only.
Pilot Study 2 – A Brief Case Study.
One notable facility from pilot study two was UST Permit #02698. This facility had two reported releases, a gasoline release reported in 1989 and a diesel release reported in 2001. The site had 13’ of LNAPL spanning across 10 monitoring wells on site. The releases had already been through an unsuccessful cleanup attempt. Use of HRSC on this site was seen as a great and necessary opportunity to fully define the LNAPL plume so that a future cleanup project will be more successful. LIF was the primary tool used to fully define the LNAPL plume (see figures 3A and 3B).
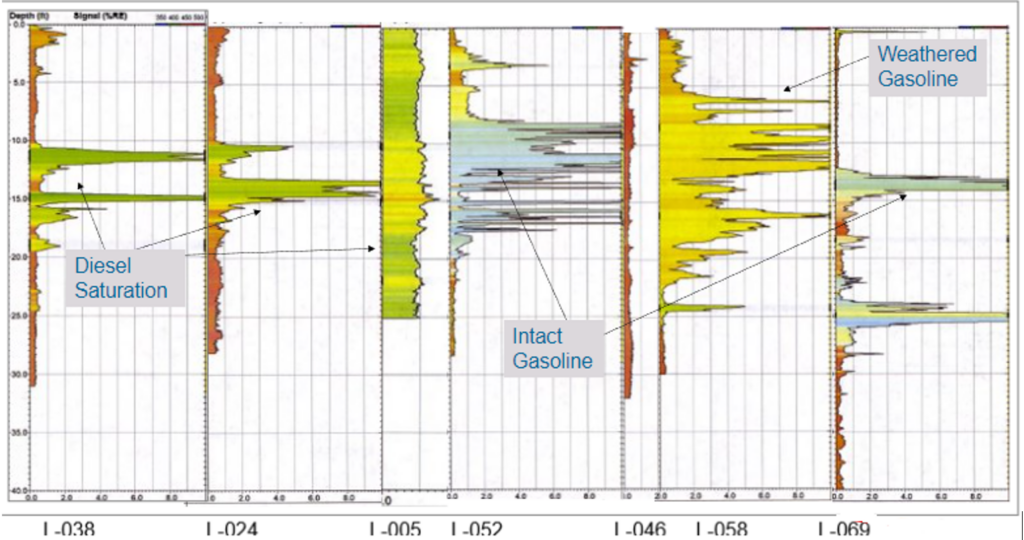
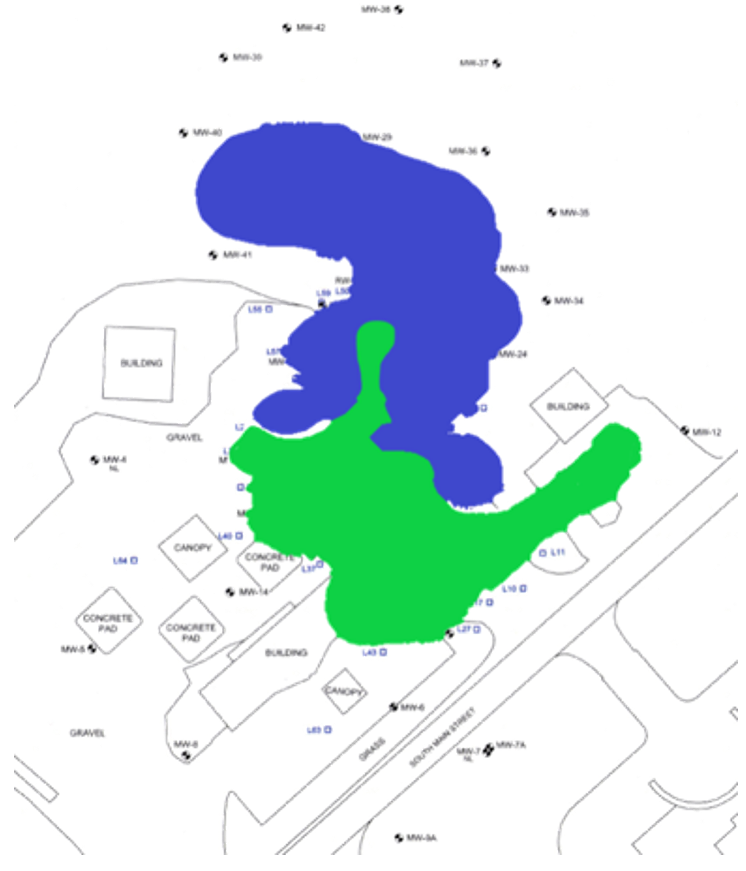
Figure 3a illustrates the capabilities of LIF to distinguish between different types and ages of petroleum products. The HRSC contractor was able to characterize the type of product found in each of the borings and the condition that the product was in (weathered or not weathered). Figure 3b shows a map of the product boundaries as depicted by LIF. The blue represents the boundaries of the gasoline free-phase plume and the green represents the diesel free-phase plume. HRSC at this site provided a better three-dimensional stratigraphic and LNPAL distribution maps. This new data will allow for a more successful and targeted corrective action that may use different technologies depending on the diesel and gasoline plumes.
The limitations of HRSC at this site were the following: uneven terrain that made it difficult to move the equipment, refusal encountered in some of the boreholes, time-consuming malfunctions of the equipment, and an inability to recover electrical conductivity (EC) data.
Pilot Study 3 – A Brief Case Study
Pilot study three was implemented to delineate additional releases and to establish fair and reasonable state reimbursable rates for HRSC work. This contract used a combination of MIP and an optical image profiler (OIP). A notable site for pilot study three was UST permit #14688. This facility had one confirmed release reported in 2009. LNAPL was found in 12 wells that spanned about a 3,600 square foot area. Figure 4 shows the three-dimensional figure generated for the facility at the end of the HRSC. The OIP at this facility was able to delineate the FPP plume well.
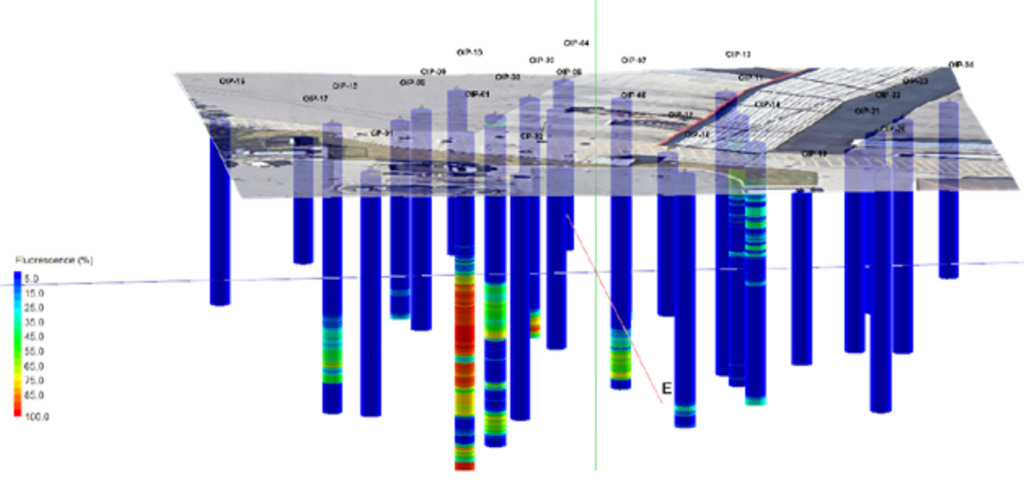
This facility had numerous issues and limitations. Due to probe refusal, OIP points had to be pre-drilled to 5 feet and the deep MIP points proposed were deemed impractical because the subsurface conditions made it difficult to use direct push drilling technology. Due to equipment malfunctions, the hydraulic profiling tool (HPT) was only successful on four boring locations and the EC data was unable to be recovered. At the time of this study, OIP technology was not able to distinguish between different types of products and only showed percent fluorescence.
Conclusions
The first and second pilot studies were paid based on a flat daily rate. The contractors initially estimated they would be able to drill about 250 feet per day, however the data collected at the end of the first two contracts revealed an average of about 150 feet drilled per day. Because of this, the third pilot contract was based on a unit rate structure where contractors were paid by foot and deliverables. This ensures that the UST Division is compensating its contractors for work completed. The UST Division’s rate schedule here.
HRSC tooling is often combined with HPT. This is a wonderful resource for determining estimated hydraulic conductivities and for identifying preferential flow pathways. This becomes important for the assessment of a site and to know where remedial designs need to target. EC is another tool that is often used and can be very helpful in determining differing lithology in the surface such as clay lenses and sand stringers, which can affect a plume’s migration.
Overall, HRSC has proved to be an invaluable resource for delineating appropriate sites for the UST Division, especially regarding source area delineation.
Author
Issue: #93 | View Archives
Connect With Us
Sign up for our monthly
e-newsletter